The Ad Hoc Reporting tool enables users with sufficient access to build reports that can be accessed via the Report Catalog. Note that your organization's access policies and permissions may differ from this standard. Please contact your organization's Company Administrator if you have questions about your access to the system.
The Ad Hoc Reporting tool is an interface to the system's underlying reports engine. No programming is required to build a report using this tool, but a basic understanding of the system and the data types it uses will be helpful.
With the Ad Hoc Reporting tool, you will define a report title to be listed on the Report Catalog and one or more variations on this report called "Report Options". Logical groupings of LMS data are provided to make creating reports easier.
The reports you define using this tool can be generated using a variety of formats, including Adobe PDF, Microsoft Word, or Microsoft Excel.
Reports may be displayed on the Report Catalog in Report Groups. Titles and the order in which reports are displayed can be modified by a Company Administrator.
The instructions detailed in this document are for the old Report Wizard. If you are using the beta Report Wizard, see the new documentation.
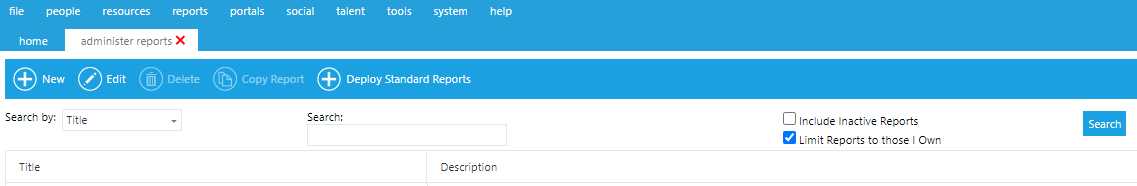
On the Administrator's Console, click on Reports > Administer Reports.
The following screen will appear:
Click the New button. The following screen will appear:
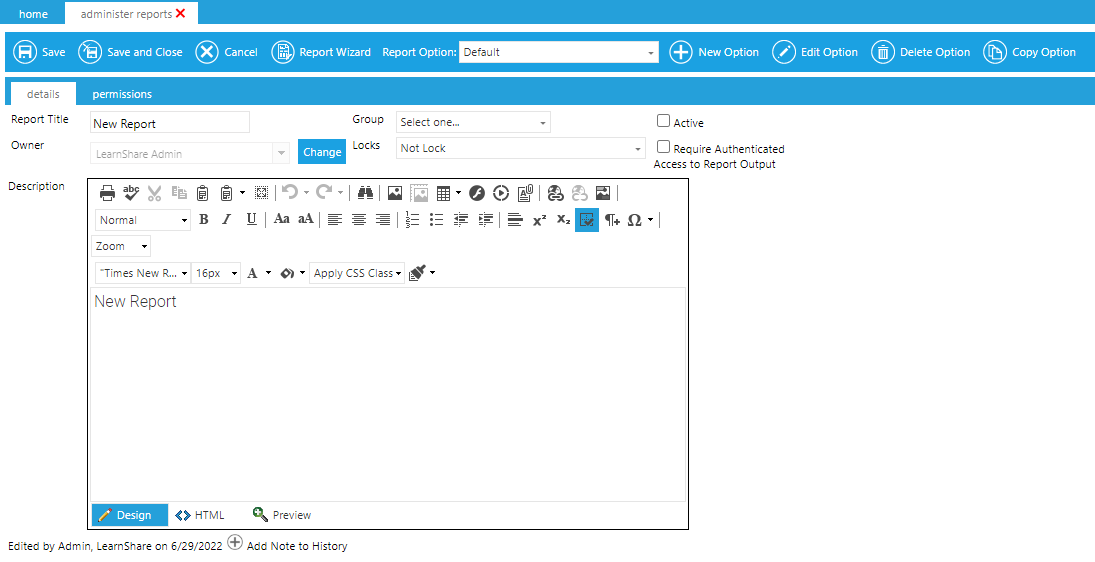
On the Report Details page, enter a report title and description, if desired. The report description will only be available to users who have access to the Administer Reports screen, typically only other administrators.
Select the report group under which you want the report to appear in the Report Catalog.
Check the Active box if you want this report to be available in the Report Catalog.
Check Require Authenticated Access to Report Output if you want this option to always be checked by default when running the report. If selected, users will still be allowed to uncheck this option at the time of running the report. If you do not select this option here, then the option will be unchecked by default when running the report; however, users will still have the option to select it when running the report. The effect of this setting is that it enhances security by forcing authentication for links to report results sent via email or other means. This may not be desired when the report is required for automated extracts, etc.
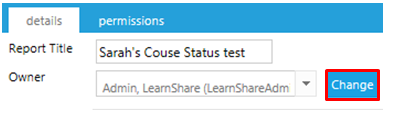
The Owner field will initially show the user who created the report. The owner can only be changed by a Company Administrator or by the current report owner. To change the owner:
Click on the Change button.
Delete the name of the current report owner.
Begin typing the name of the new report owner.
In addition to the owner, there are also four levels of locks that can be placed on a report. The locks do not apply to Company Administrators. Any Company Administrator can change, copy, or run a report regardless of the locks on that report.
The available locks are:
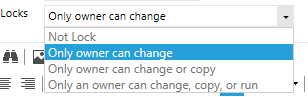
Not Lock: Any user with access to the Administer Reports screen and within the permissions of the report can make changes to this report.
Only an Owner can Change: Only the report owner can make changes to this report; however, others can still copy the report and then make changes to the copy.
The report wizard button is still active, allowing others to see how this report was set up, but no changes made by an unauthorized user will be saved.
Only an Owner can Change or Copy: Only the report owner can make changes to this report or copy this report; however, others can still run this report.
The report wizard button is still active, allowing others to see how this report was set up, but no changes made by an unauthorized user will be saved.
Only Owner can Change, Copy or Run: Only the report owner can change the report, copy the report, or run the report.
The report wizard button is still active, allowing others to see how this report was set up, but no changes made by an unauthorized user will be saved.
The Permissions tab allows the report owner to select which security roles should be able to access this report in the Report Catalog. The permissions should be set up when creating a new report and can also be changed at a later time by editing a report.
The default permission for any new report is the Company Administrator role.
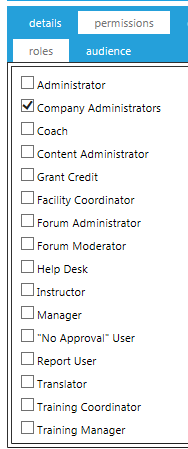
The Audience tab can also be used to further define the audience, or you can choose to not select any security role and only use the Audience tab.
The Roles tab and Audience tab can also be used together. For example, you could select the Manager role and then pick certain Business Units (domain) on the Audience tab. This would make the report only available to Managers in the select business units.
Report options are used for grouping and sorting criteria.
An ad hoc report can have one or more options. Each option is essentially its own report. Each option can have a different data source and report type. For example, an Enrollment Status report could have a Certificate Option, a Required Audience Option, and an Expiring Course option, each with its own data source, report type, and criteria.
The Report Option will initially be labeled “Default”.
Edit Option
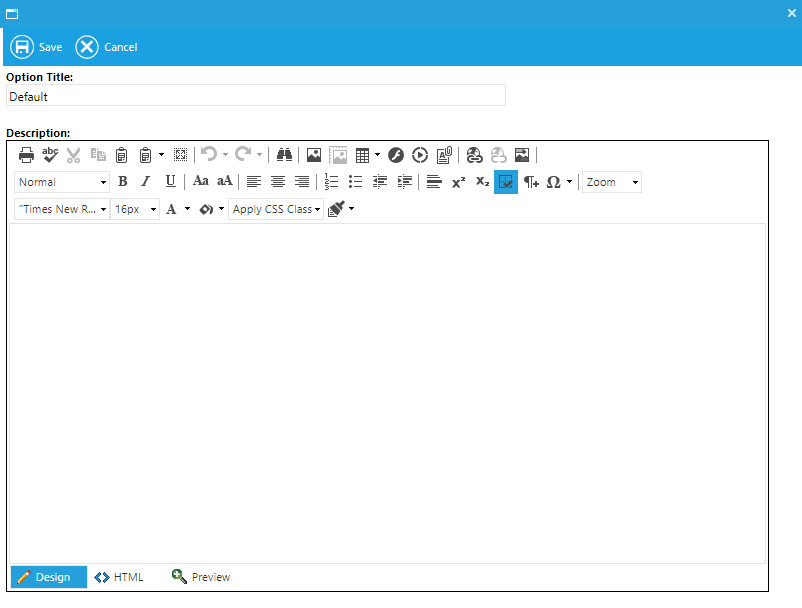
To change the title of the Report option, select Edit Option.

The Edit Option pop-up box will appear. Here you can change the name of the report option and add a description. This description will be visible to anyone who can view the report in the Report Catalog.
Since this description will be visible to anyone who is able to run this report, use this description field to document important information about this report, especially if this report will be run by users who do not have access to the Administer Reports screen.
Important information may include defining the Date Criteria. The report user needs to know if they are selecting the Enrollment Date Range or the Completion Deadline. List any criteria that was pre-selected (For example, will this report show all enrollment statuses or only Complete?).
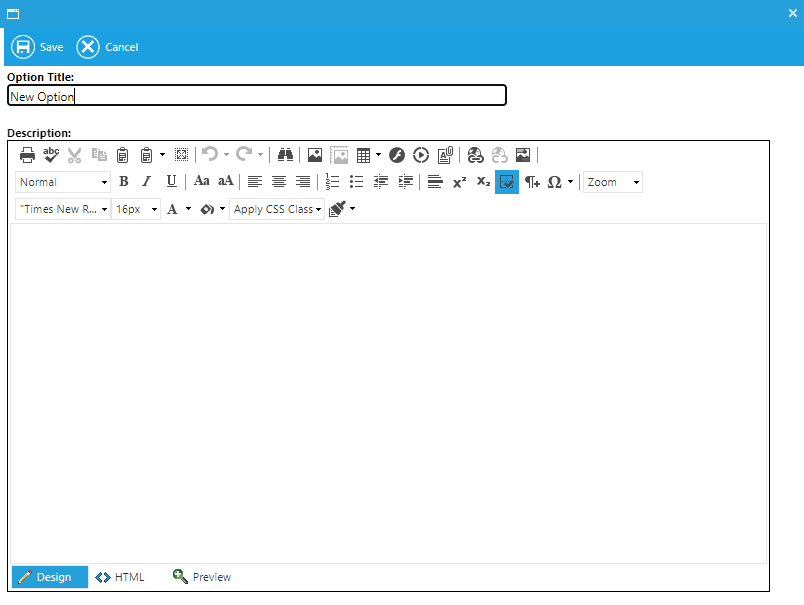
Select New Option to add an additional option to the report.
When New Option is selected, the Edit Option pop-up box will appear. Give your new option a descriptive title so that the report user can easily decide which option to use.
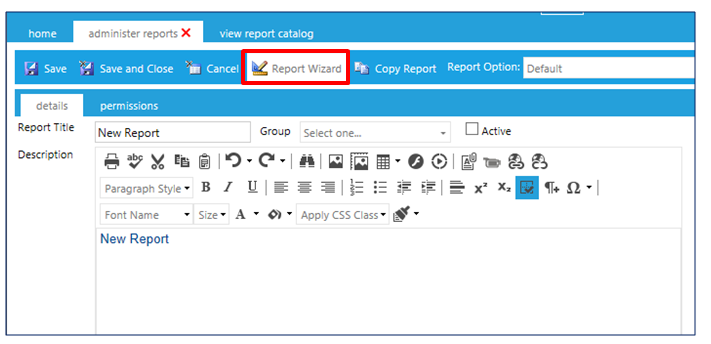
Select the new option from the drop-down, then click on the Report Wizard button to create the report for this new option.

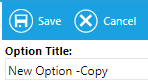
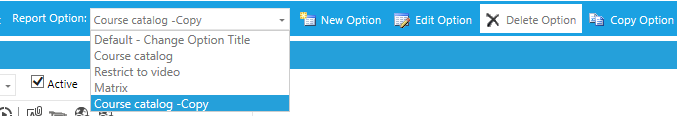
To copy an option, select the desired option from the Report Option drop-down and then click Copy Option. The Copy Option feature should be used when the data source and report type of the original option are going to remain the same and changes are only needed to criteria, sorting, or summary screens.

The Edit Option box will appear with the title of the Option – Copy. Change the Option title and save.
Click on the Report Wizard. Since the option was copied, the data source, report type, column selection, etc., of the original option will already be selected.
Within the Report Wizard, click Next on the Data Source screen (that is, keeping the data source the same as the original option).
If the data source is changed, all selections on the following screens will be lost.
On the Report Format screen, use the drop-down to select the screen where the changes are going to be made.
Make the desired changes to the Report Option, then click Finish on the Preview Report screen to save the new selections.
Use the Delete Option if it is no longer needed. Select the option and then click the Delete Option button.
This function allows you to copy an Ad Hoc report to customize for a different audience while using the same data source as the original. If you would like to use a different data source, it is best to create a new report then use the Report Wizard.
The Copy Report button in the menu bar will not be available on Standard and Custom reports; it will only be visible for Ad Hoc created reports. The only option you may edit on a Standard report is the Permissions tab. On a Custom report, you will be able to edit the Title, Description, Report Options, etc. However, the Report Wizard button will not be available.
From the main Administer Reports screen, select an existing Ad Hoc Report, then click on the Edit button.
In the report's menu bar, click on the Copy Report button. The following notification box will pop up:
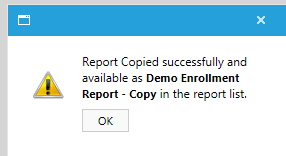
The report will be renamed with the original appended with "- Copy". Click OK.
Click Save and Close or Cancel to return to the main Administer Reports screen.
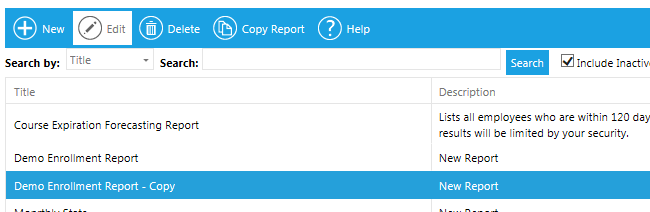
Check the box to include Inactive reports in the Report list, since all copied reports will default to inactive.

The copied report will appear in the report list.
Click to select the copied report, then click Edit to open it.
You can now edit the report name, description, permissions, options, and Report Wizard screens any way you wish.
Click Save and Close when your selections are complete.
The User Criteria screen allows you to set criteria that can then be used by the report user to modify the report within the established parameters. This means that every time the report is run, it will only return results which fall within the parameters set on this screen.
The selections made on this screen can have a huge impact on your report results. Listed below are some general information and tips to help make this screen work for you.
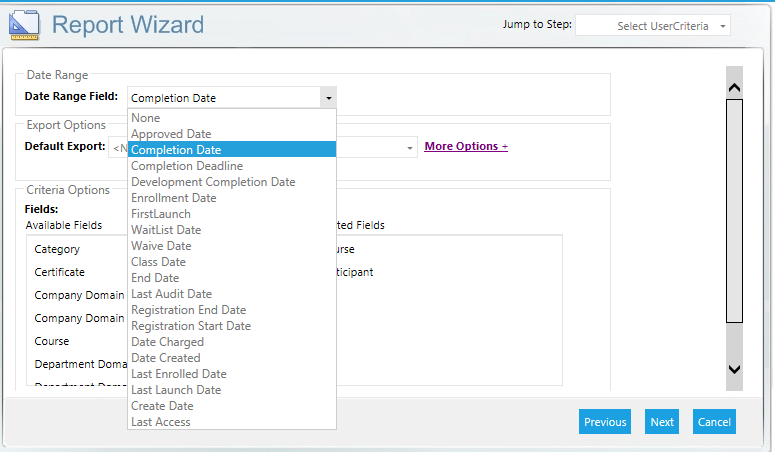
Setting a date range is optional, but can be helpful in limiting the scope of the report. Just be sure to select a date range that makes sense with the intended report results.
For example, if the intent of the report is to show all enrollment statuses, then Enrollment Date would be a good date range field. This would allow the report results to be limited to users who had enrolled during a set time period, but would still show all enrollment statuses for those users. In contrast, if Completion Date was selected, then the report would only show the users who had a complete status since they are the only users with a Completion Date.
The Export options allow you to select a default option and customize the available options for your report.
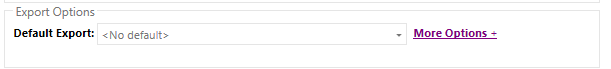
To set a default export, simply click on the Default Export drop-down and select an option. Now, when a user runs this report, the selected default will be displayed first in the list of available export options.
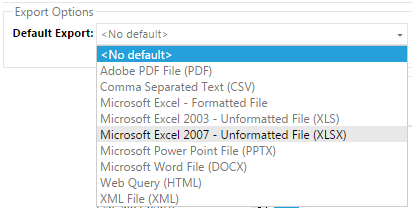
The list of available exports may vary based on the configuration of your system.
The More Options link allows you to customize which export options will be available for this report.
.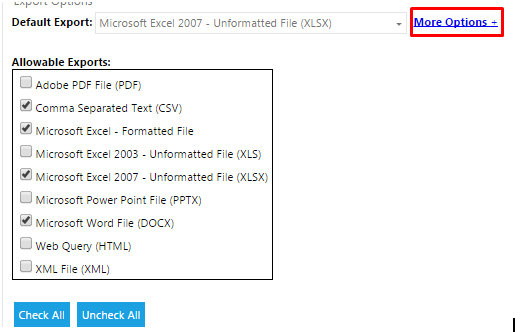
The report user will be able to select from any checked export type. The designated default type (if selected) will display first in the list.
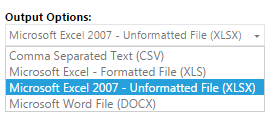
If all export types are unchecked, then all options will display to the report user.
The available fields will list each domain available in your company and the course. Other criteria options will also be available based on the selected data source.
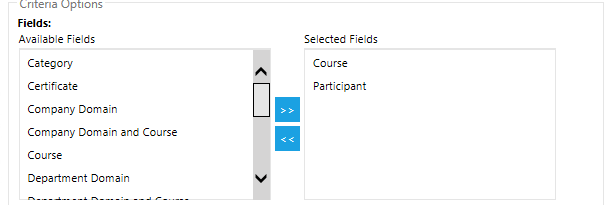
To select a criteria, simply highlight the selected field and click the  arrow. You can also select multiple fields at once. To multi-select, simply click on a field, hold down the CTRL key on the keyboard, and click the next field. Next, click the
  arrow to move the highlighted fields into the Selected Fields box.
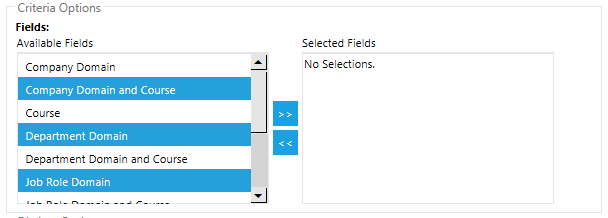
To multi-select a group of fields all in a row, click the first field, hold down the SHIFT key, and then click on the last field.
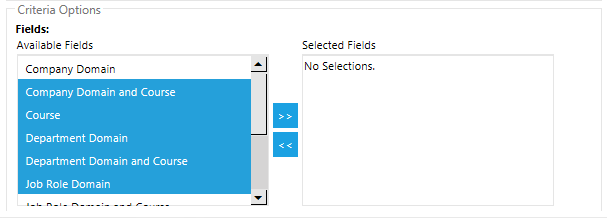
Next, click the  arrow to move the highlighted fields into the selected fields box.
.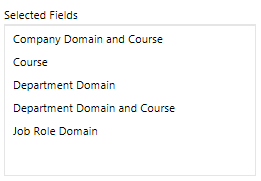
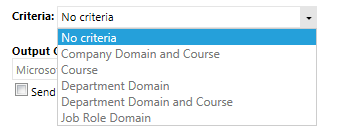
When the end user runs this report, the selected fields will appear in one list as the criteria option.
When the User Criteria has been set, click Next to continue.
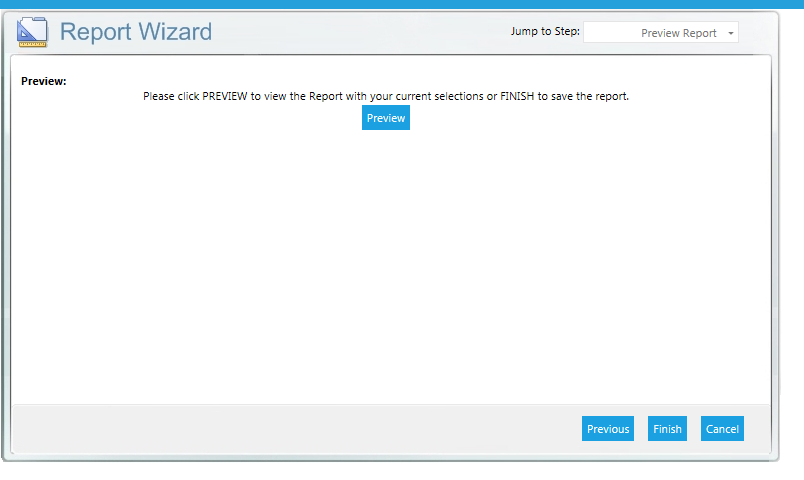
On the final screen, you may be given the option to Preview the report. Note that the Preview option is not available for audience-based reports. Preview your report or just click Finish to save your report.
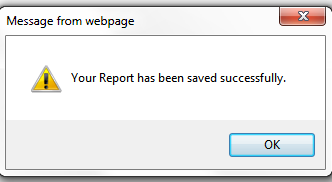
When you click Finish, the LMS will confirm that your report was saved.
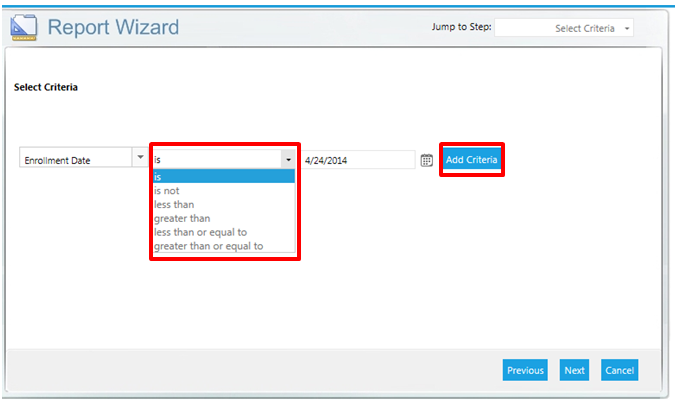
The criteria drop-down will list all of the data details that are available based on the data source selected.
The options in the center drop-down may change based on the data detail selected.
The data detail options are:
Once the criteria has been selected, click the Add Criteria button.
The selected criteria is now displayed above the input. The “and/or” option has also been added to the screen.
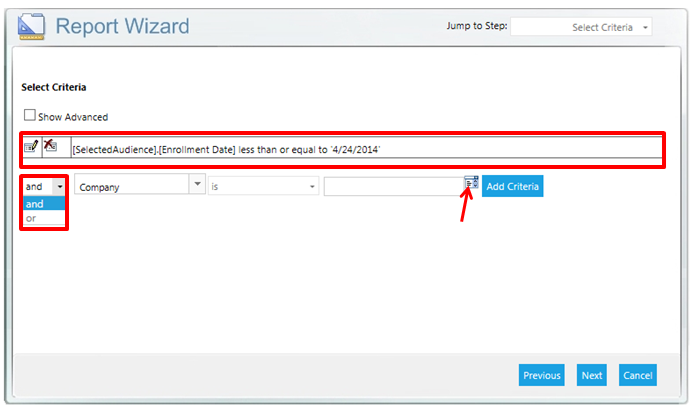
In the example above, the domain of company has been selected as the next criteria detail. Since there is a set list of company names in that domain field, a list icon appears next to the final drop-down. Click on this icon and then select the company name from the list.
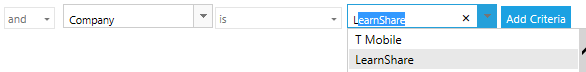
For text items that do not have a set list (for example [course] “long description,”), the list icon will not appear. In those instances, simply type the desired text into the final field.

When using multiple criteria, it is important to set up the and/or statements correctly. Incorrectly set up criteria statements is one of the most common reasons for blank reports – essentially no data matches all of the criteria set.
In the example so far, the report results are limited to everyone who has an enrollment date on or before 4/24/2018 and is in the company LearnShare.
However, if I want to expand my audience to include everyone in the company of LearnShare and everyone in the “No Company” level of the company domain, I need to do the following:
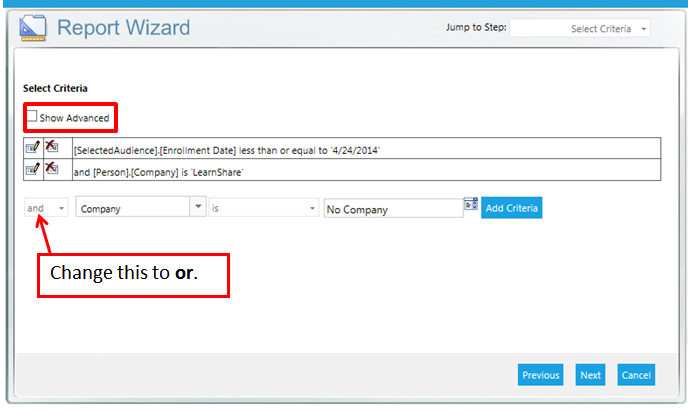
Change “and” to “or”. If this is left at “and,” the LMS will only look for users who are both in the LearnShare level of the company domain and in the No Company level. Since no user can be in both levels, the report will be blank. By changing it to “or,” the LMS will look for all users in the LearnShare level or in the No Company level who have the correct enrollment date.
Check the Show Advanced criteria checkbox. Whenever “or” is used, the Show Advanced criteria checkbox should be checked. This will allow you to clearly define the “or” statement.
The advanced criteria checkbox can be used with “and” or “or”. Its purpose is to allow for managing order of precedence.
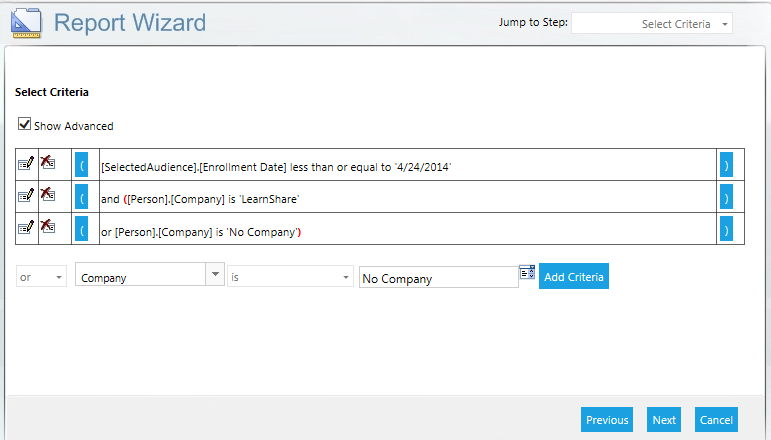
Click on the blue parenthesis to show where the or statement should begin and end. The LMS will insert the red parenthesis based on your selection.
You can continue to add criteria until it is all set. There is no limit on the number of criteria allowed. Criteria will be listed as five rows per page.
If a criteria is added in error, the cancel icon  can be used to delete a criteria.
When all of the criteria have been set, click Next to continue.
Select criteria require a specific numerical value. Use the following information for these criteria.
Active/Inactive: To restrict users or resources to only active or inactive, select the appropriate “Active” data detail. Then, use the following numerical value to restrict to active or inactive.
So the criteria for an active resource would look like this:

Resource Status:
Curricula Type:
Resource Type: To restrict the report to a specific resource type, there are two options.
Select the criteria “Resource Type” and enter the full text, as shown below.

Or you can select the criteria “Resource Type Code” and enter the corresponding numerical value.
Once the setup is complete, you are ready to begin creating the report.
Click the Report Wizard button at the top in the tool bar to access the Ad Hoc Report Wizard.
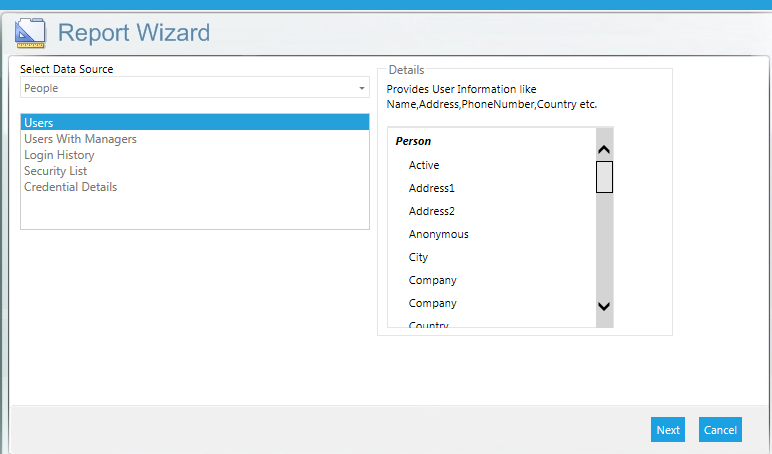
Select an appropriate data source for your report. The details on the right side show which fields are available with the selected data source.
It is vital that you select the correct data source in order for your report to show the data that you need. See the Data Sources document for detailed information on each data source.
If you select a data source and add report columns and then decide to change the data source, you will lose all of your column selections and have to repeat that part of the process.
Use the Data Model Report, a LearnShare standard report, to view the details associated with each data source. The report also contains a description of each detail field.
Click Next to continue.
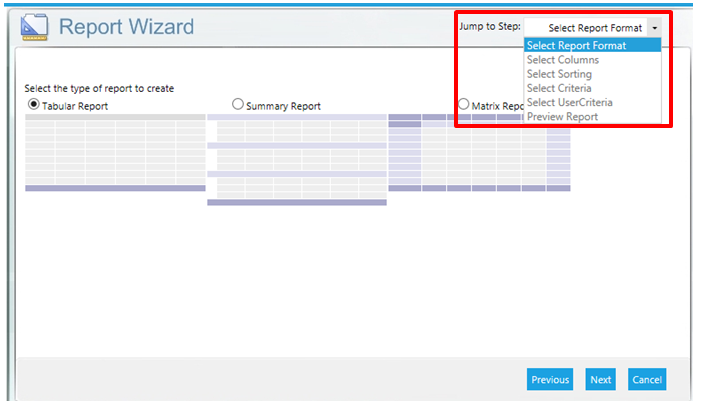
Select the Report Format. Options are:
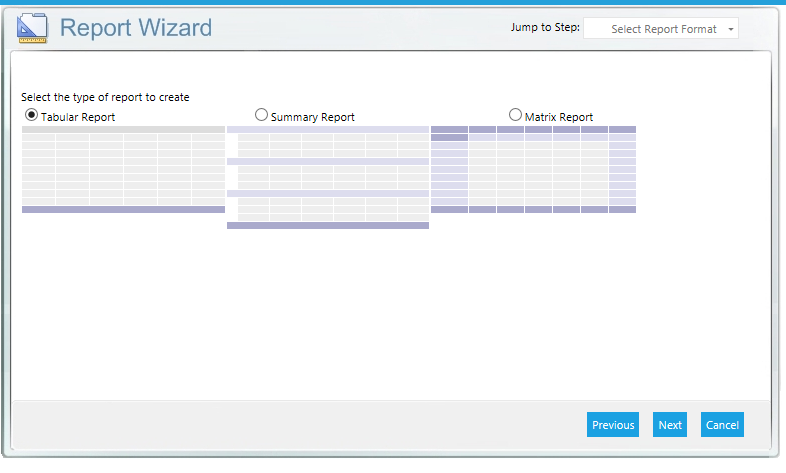
Tabular: This is the most basic (and commonly used) type of report. The report output is organized in a multicolumn, multirow format, and provides granular detail. Each column in the report corresponds to a selected column in the database table.
Summary: A summary report is similar to a tabular report in that it also provides granular detail. However, this report type also provides grouping of the data with subtotals and other summary information.
Matrix: A matrix report allows you to group data in a high-level summary. This report type does not allow you to see granular detail.
Example Scenario: The company-wide required course called “Business Ethics” is currently being rolled out. I want to run some reports to see the status of this course throughout the company.
A Tabular report can be used to list every employee in the company and their current course status.
A Summary report can be used to show every employee and their status, and then summarize how many employees are complete, incomplete, etc.
A Matrix report can be used to display how many employees in a selected domain (for example, Location) are complete, incomplete, etc. This report would not show the specific course status of an individual.
Click Next to continue.
Once the report type is selected, the screens that follow will differ based on the selected report type. Select the appropriate report type for additional information.
Select the columns that should appear on your report. The column options are based on the data source that was initially selected. If you do not see the option for a column that you require, you may need to select another data source.
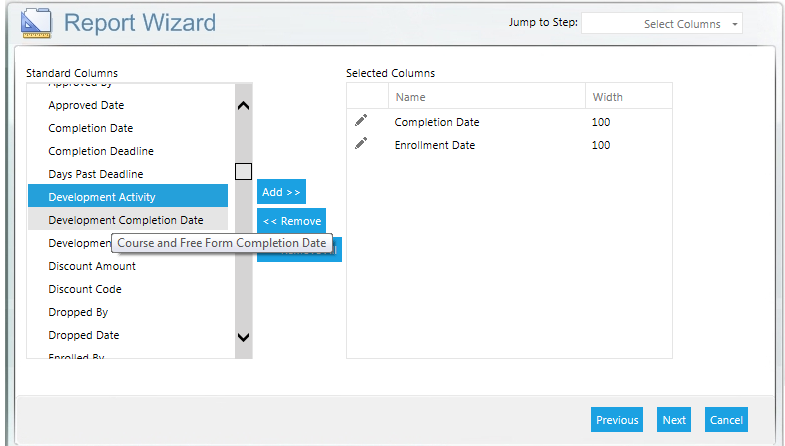
To select a column, highlight the column and click Add to move it to the right side. The CTRL-click and SHIFT-click commands can also be used to pull over multiple columns at once.
Hover over the column title on the left to see a brief description of the selected data detail.
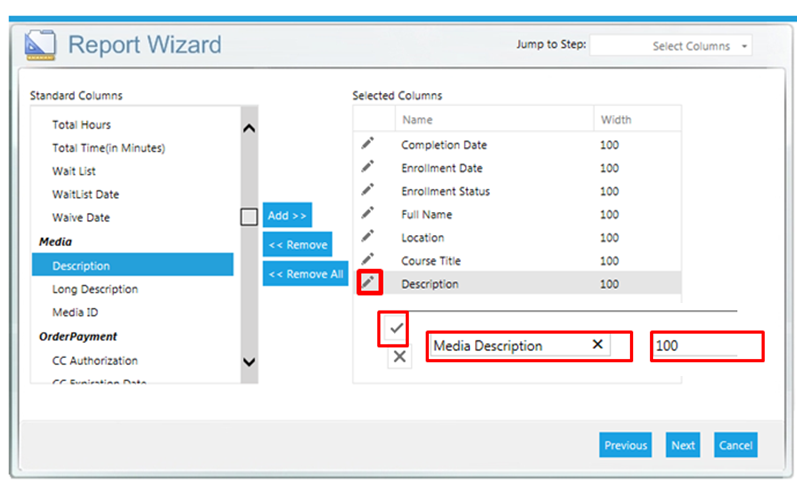
Once all of the columns have been selected, you can edit the column name, width, and order.
To edit the column name and width, click on the pencil icon. The column name and width can now be changed. When your report is run, the edited version of the report column will appear in your report.
Click on the check mark to save your changes.
The column headers will appear on your report in the order that they are listed in the Selected Columns box. To change this order, simply drag and drop the column header to the desired order.
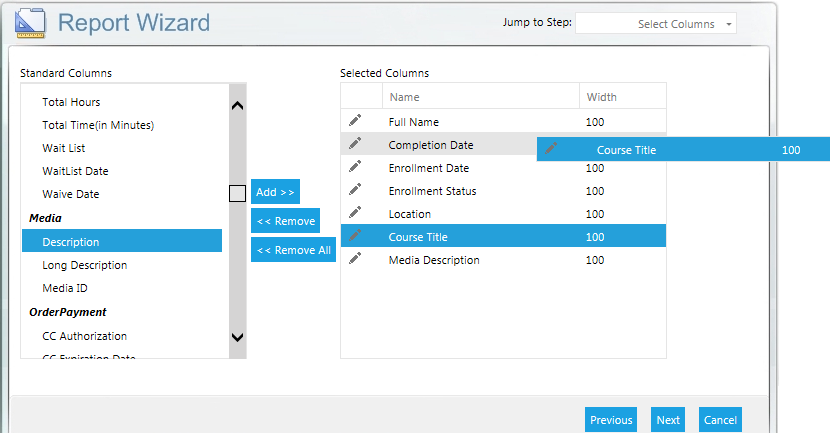
When the columns have been selected and all desired edits have been made, click Next to continue.
The next screen allows you to select how the data should be organized. You can select up to three columns by which to sort. Only columns that were selected on the previous screen will be listed as available options by which to sort.
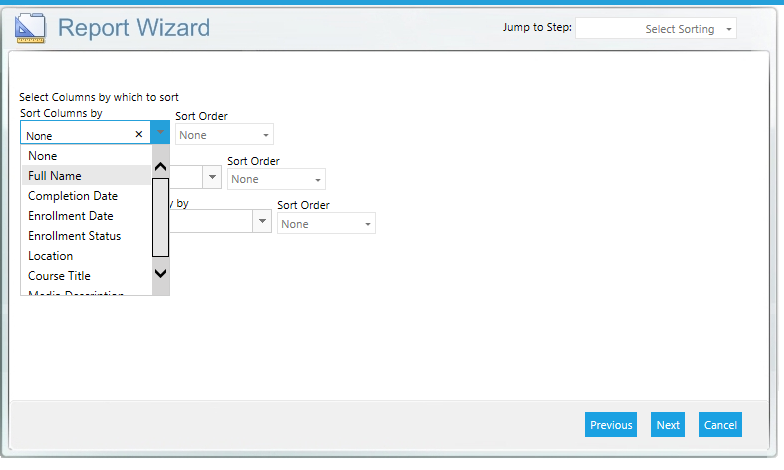
Click Next to continue.
Select the columns by which you want to group your report. The “Group Dates By” field will remain inactive unless a date criteria is selected.
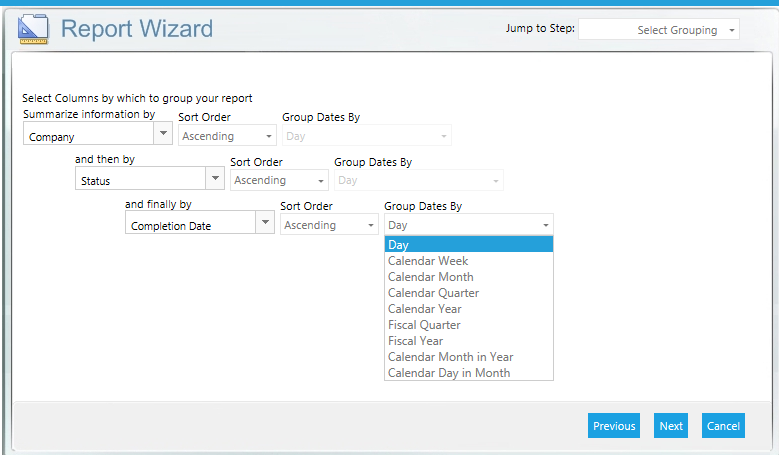
Once you have made your selections, click Next to continue.
On the following screen, you can select which fields to summarize. If there are not any fields that have summarizable data, simply check the Record Count check box.
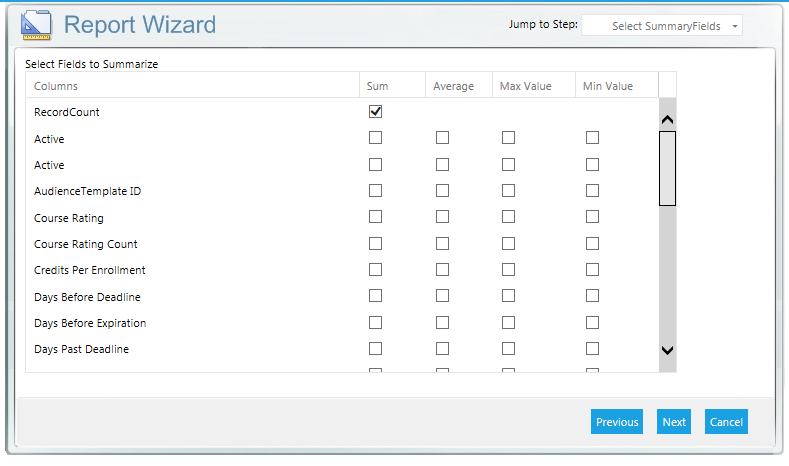
Click Next to continue.
Once the matrix report option has been selected, the following screens will differ from the screens used to create tabular and summary reports.
On the first screen, you need to select the fields that should be grouped in your rows and columns. You may select one or two fields for the row and columns. The “Group Dates By” field will become active when a date range field is selected.
The available fields will vary based on the data option initially selected.
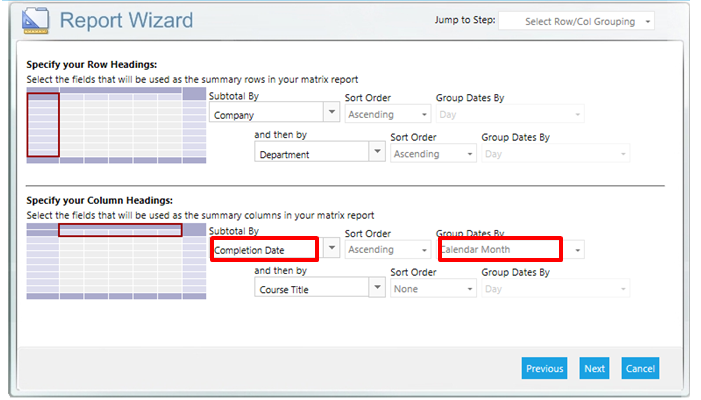
Click Next to continue.
Similar to the Summary Report, select the desired summary information and summary type.
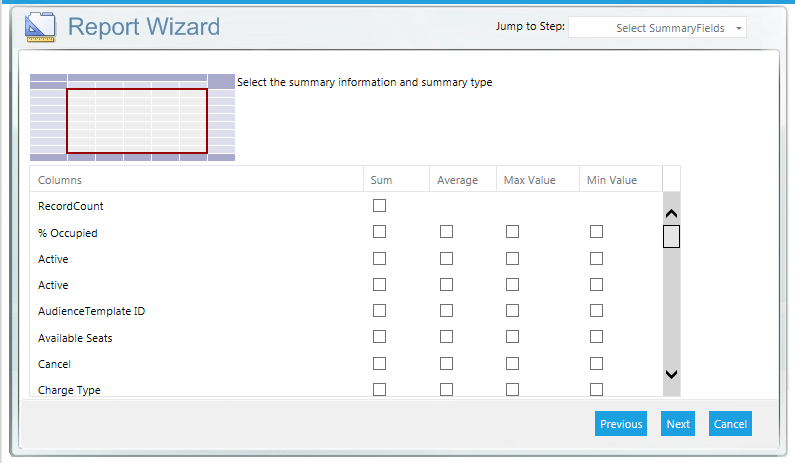
Click Next to continue.
The following screen is the Criteria Selection screen. This is the same screen for all three report types. See the Criteria Selection section for detailed information.
The final screen is the User Criteria screen. This screen is also available for all report types.
Once the criteria has been selected, you can choose to preview your report. A matrix report will look similar to the one pictured below.
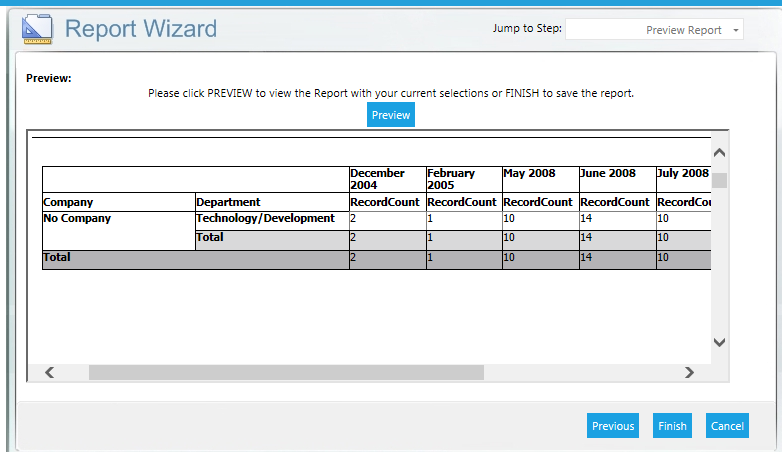
If you are satisfied with your report, click Finish to save the report.